From Paper Maps to the Web: A DIY Digital Maps Primer
*/
I was invited to the National Library of Colombia’s 2nd Digital Book Week as a speaker and to give a workshop on digital mapping tools. I thought it would be useful to share that workshop since it encompasses a lot of different processes and tools that make digital cartography today very accessible. It is a primer on working with various free web mapping tools so you can make your own awesome maps.
TL;DR
You will make this. This tutorial assumes you have a digitized map and some data you want to overlay on it. The general steps covered are:
- geo-referencing the scanned map so that web tiles can be generated
- generating GeoJSON data to be overlaid
- creating a custom base map (to serve as reference/present day)
- integrating all assets in an interactive web page
Note: This tutorial assumes you are using Mozilla Firefox, Apple Safari or Google Chrome. You will be playing with the developer console and I don’t have multi-browser instructions.
Let’s get started!
This is what we want to make. It is an 1891 map of Bogotá available in the National Library of Colombia (link requires Flash Player) annotated with some data found in an 1888 Bogotá City Directory.
1) Geo-referencing
The first step after scanning a map is to add geographical data to it; to establish an equivalence between its pixels and the geographic location they represent. This is called geo-referencing. This process will distort the scanned image:

Original scan (shrunk, of course)
…to match the Mercator projection which is used in most web mapping projects such as OpenStreetMap or Google Maps:

Geo-referenced scan in Mercator projection
The amount of distortion will depend on the quality of the survey, preservation state and original projection of the map. You may be asking: how did this magically happen? There’s commercial and open-source software that allows you to geo-reference images but the point of this tutorial is doing all of this without installing any software other than your web browser. Enter: The Map Warper! Map Warper is a web tool that lets you upload your scanned maps and provides a simple interface for you to geo-reference them (or “rectify” in geo parlance). Referencing boils down to you telling what part of the scanned map (left) corresponds to what part of the Mercator projection (right):

The split-view rectification interface in Map Warper
Notice the pins in the image. Each pin has a number and the same pin is present in both views. From them you can tell that North in the scan is pointing leftwards while East is pointing upwards. The more pins you add, the more precise the referencing will be but the slower the final image generation. However, image generation happens only once so I wouldn’t worry too much about that. It’s more an issue of how many pins you are willing to add. The map in this tutorial has 101 pins.
A final consideration in this process is to make sure you get a high-quality geo-referenced image after distortion. The process of distorting the original image is called resampling 1. In the Map Warper’s Advanced options you can set the method from the low-quality but fast Nearest Neighbour to high-quality but slow Cubic Spline:
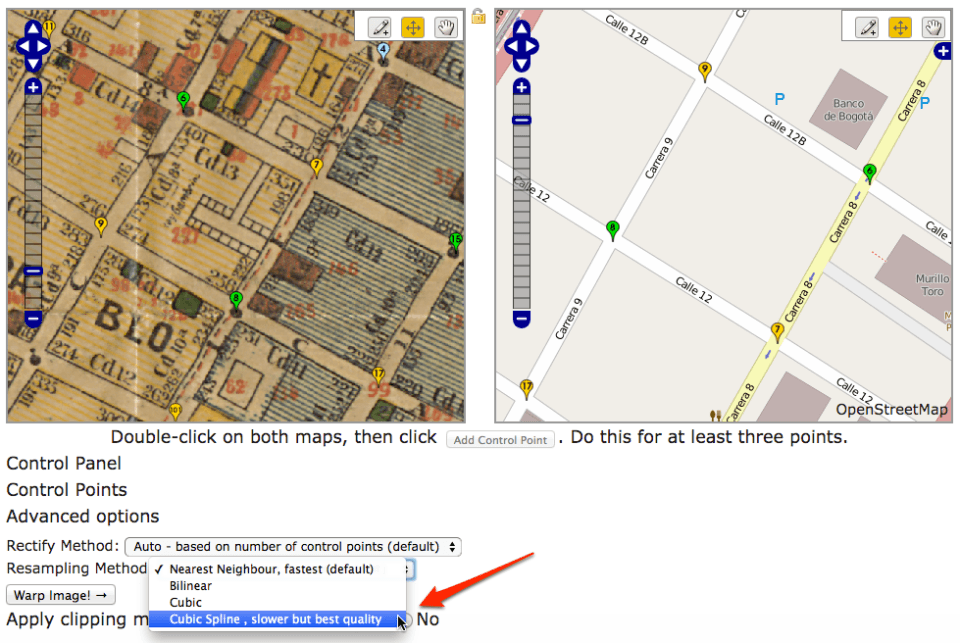
Select “Cubic Spline” in the Resampling Method option
You can view the final map here. You can also download high-resolution assets in the Export tab. However, I think the main perk you get from the Map Warper are the tiles. It’s that URL template you see here:

You can find the tile URL in the “Export” tab
The template is:
http://mapwarper.net/maps/tile/4949/{z}/{x}/{y}.png
You will need this URL! Keep it somewhere safe. Map Warper has a tile-generating engine that uses the geo-referenced image to produce square map tiles at different zoom levels and coordinates so that only the necessary parts of the interactive map get displayed as you use it2. This is an example tile:
Web maps are made up of millions of these
2) Data extraction
We have the map. Now we want to figure out what data to show on it. Our example uses this 1888 City Directory of Bogotá, Colombia’s capital city. This directory is information-rich, containing tens of thousands of person names (each with address and occupation), dozens of different occupations (described in page 4) and advertisements (along with many store addresses and owner names).
The directory provides an interesting view of life in late XIX century Colombia: lawyers, photographers and accountants share pages with saddlers and blacksmiths. I went the boring route and looked for some prominent politicians of the time, such as then-sitting president (page 222, first in the second column). The current list contains seven people: four presidents, a vice-president, a minister and an acting president3. The list includes:
- name
- office (highest office held in the Colombian executive branch)
- term
- page (where it appears in the directory)
- occupation (as displayed in the directory)
- address
- Wikimedia Commons photo URL
- latitude, longitude (a placeholder set to downtown Bogotá that we will change in this step)
You can create your own list from other data you find more interesting or useful. Make sure to include latitude and longitude columns and save it as a comma-separated list.
GeoJSON
So far our data is contained in a comma-separated list, but web mapping tools generally use the GeoJSON standard. GeoJSON is based on JSON which is one of the most popular ways of structuring data in the web. GeoJSON uses the concept of “features” to describe geographic data. Those features can be points (as is our current case) or more complex geometries such as lines, multilines and polygons. Each feature is described by its geometry (the point, line, polygon itself) accompanied by its properties which is whatever extra data you want to associate with it (in our case, a person’s name, address, photo, etc.). For example4:
We need to convert our spreadsheet into a GeoJSON object and then update the placeholder latitude and longitude values to the proper values. We will use the map itself to help us figure out those. We need a tool that lets us generate GeoJSON that we can easily manipulate.
Enter GeoJSON.io! This is “a quick, simple tool for creating, viewing, and sharing maps”. GeoJSON.io has this nifty interface we can use to create the GeoJSON we need.
Go ahead and open GeoJSON.io in a new browser window. you will see the default map at full zoom out. Now we need to do a little hacking. Right-click somewhere on the map and select Inspect Element:
Inspect Element" width="90%" src="http://i.imgur.com/EIqHCRu.gif" title="" />Right-Click → Inspect Element
This opens an advanced developer view that let’s you view and modify the code of the page you are viewing (in this case, the map interface). GeoJSON.io includes a programming interface (API) that lets you control the map being displayed. The core of this site is MapBoxJS, which is itself built on top of Leaflet, an “Open-Source JavaScript Library for Mobile-Friendly Interactive Maps”. I mention both because, for the most part, whatever works on one of them works on the other (do read the documentation before making any decisions!) and I will be referring to it as Leaflet instead of MapBoxJS.
In the Console tab you’ll see some text and, at the bottom, a cursor where you can execute JavaScript code. You’ll see some comments from the creator of GeoJSON.io and a row where you can type new JavaScript commands. Type this in that area and press ENTER (refer to the animated GIF below):
This will center and zoom the map in Bogotá, Colombia, the area covered by the 1891 map. Now type this:
…and press ENTER. This will add the tile layer itself. Notice that line of code includes the URL you copied in step 1. The end result will look something like this:
A quick “hacking” of GeoJSON.io
You can now close the development window (not the browser window!).
Note: You will need to re-apply this code every time you load GeoJSON.io since it doesn’t save modifications made via console. You can save the data you add to the map by logging in.
Adding data to GeoJSON.io
Now we will use this modified version of the map as a base to properly geo-locate the CSV list of presidents.
Drag the CSV file you downloaded on the map:

Drag and drop magic in GeoJSON.io
You will notice how the data is immediately converted to GeoJSON (right pane) and the map zooms in to show the points that represent each president (left pane). You can see a small green message (top left) showing seven features were imported.
But the 1891 map disappears! No worries. This just means that the map is zoomed in “too close to the ground” and the tile URL template does not have images up to that level. Zoom out a bit and you will see the 1891 map appear again.
Moving the points around
The points in the CSV are all geo-located on top of each other on the same point in Bogotá’s Plaza de Bolívar. We need to move them to their proper location. If you click the gray pin you will see the additional data for the topmost one (General Rafael Reyes). His address at the time was 50, Calle 16 (50 16th Street). We need to find that address in the map.
Finding the address will be relatively easy since each block has its starting and ending address numbers written on the corners. You will notice that “Carrera” (vertical-ish streets) numbers increase northward with odd numbers east and even numbers west while “Calle” (horizontal-ish streets) numbers increase westward with odd numbers south and even numbers north:

We will place the point in the approximate location between corners in a given block. To do so, activate editing mode by clicking the

icon. Pins will have a pink outline and you can move them around. Place the pins in the desired location and click “Save” to commit the changes:
There are some tricky addresses but this task can be quite enjoyable since you literally get lost in 1891 Bogotá. An interesting aspect of this map is that government buildings are colored with the Colombian flag. When you place Rafael Núñez Moledo, the sitting president at the time, you will notice that his address matches one of those flag-colored buildings (the Casa de Nariño).
Saving the GeoJSON
Now we must generate the final GeoJSON that we will use to create our interactive map. Simply select Save > GeoJSON in the editor menu. A file called map.geojson will be generated and downloaded to your computer. You can also just download the one I did, cheater!
3) Creating a 2014 custom map (optional)
We want to be able to compare this 1891 map with present day Bogotá so we can see how things have changed over time. We need a “base map” which is basically what GeoJSON.io has when you load it: a (hopefully accurate) “plain vanilla” street map of the present day world. You could use the standard OpenStreetMap tiles or use a service such as MapBox to produce a completely custom map (MapBox uses OSM data). MapBox is quite powerful: it lets you change colors, customize what gets shown (streets, buildings, parks, etc.) and even use satellite imagery!
I’m not going to describe how to create your own map in MapBox. I will leave that to their excellent tutorial. When you’re done, you will need to write down the Map ID which looks something like username.k53dp4io. You can use the MapBox projects page to see all your maps and easily copy the ID to clipboard:

NOTE: If you don’t want to go through the process of customizing your map, you can use an example MapBox ID later.
4) Final assembly
We now have all the assets required to assemble our interactive map:
- map data in GeoJSON format
- a tile template for the 1891 map
- a tile template or MapBox ID for the 2014 map
We will prototype the interactive map in JSFiddle, a tool that lets you quickly create and test HTML/JavaScript/CSS code. Check out this quick tutorial to familiarize yourself with the interface.
JSFiddle has four main panes:
- HTML code (top left)
- CSS code (top right)
- JavaScript code (bottom left)
- The end result (bottom right)
JSFiddle takes care of assembling the three code components into the result every time you click “Run” (in top, blue bar).
HTML & CSS
In this example the HTML and CSS parts are very simple. We only need a rectangular area in the page that will display the map and all its controls.
We need an HTML element where the map will go. Type or copy/paste this in the HTML pane:
With this code we create a div element whose identifier is map and, as you can imagine, it will contain the map. We now need to “style” the element (give it a width and a height and, if you want to, borders and other attributes). Styling is controlled with CSS. Type or copy/paste this in the CSS pane:
This applies a width and a height of 400 pixels to the element whose identifier is map (the # prefix means “id” in CSS). Of course you can make the rectangle bigger (if your monitor is big enough) and apply other attributes between those { } brackets (e.g.: background-color: #f00; for a red background if you want to see the element with no map) but I just wanted to keep it very simple.
If you click “Run” now you won’t see much (unless you added a background color or a border to the element). That’s all the HTML and CSS you will need for now.
Adding MapBoxJS
To present the map and make it interactive we will need some external assets and JavaScript. I mentioned Leaflet and MapBoxJS before. We are going to need them in order to present and control the map. Leaflet is included in MapBoxJS so we just need to worry about the latter. MapBoxJS is composed of two separate files: a JS file and a CSS file. You already have an idea of what the CSS file does. The JavaScript file contains all the interactive mapping magic. These are the URLs to the files in question (note that it is not the latest MapBoxJS version but no worries, it will work):
CSS file:https://api.tiles.mapbox.com/mapbox.js/v1.5.0/mapbox.css
JavaScript file:https://api.tiles.mapbox.com/mapbox.js/v1.5.0/mapbox.js
In the left column in JSFiddle find the “External Resources” section. You need to copy those URLs and paste each in the JavaScript/CSS URI box and click the + button. You will see something like this after you do it:

Your “fiddle” once you add the two MapBoxJS files
This will make JSFiddle load those files the next time you click “Run” and from then on.
Hello map!
Now comes the part we’ve been waiting for! Let’s write some JavaScript so we can see the 1891 map. Write this in the JavaScript pane:
…and click “Run”. This is what you should see:
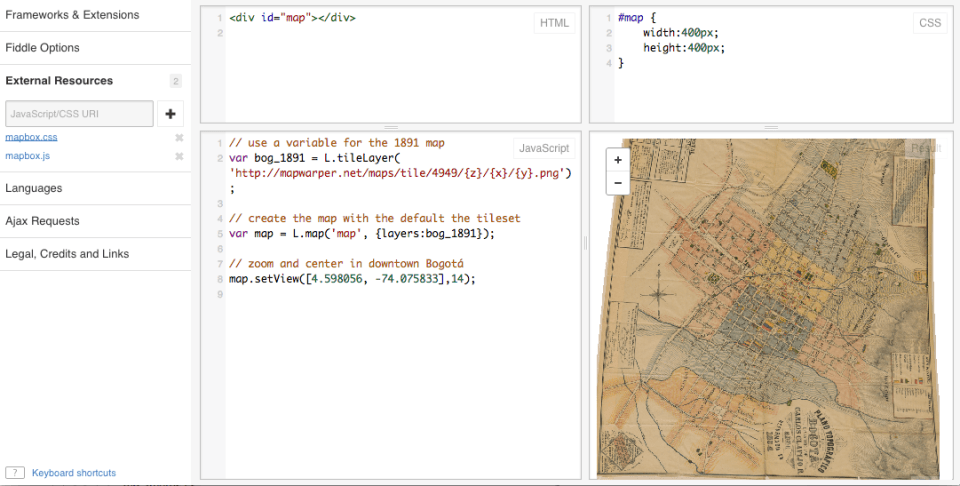
You first web map!
Thanks to Leaflet, it’s that easy to work with web maps.
Note: I’m not going into details here about the different aspects of the Leaflet or MapBoxJS APIs. They each have their own tutorials and examples. I will instead give some code snippets and superficially explain what they do. You will copy, paste and click “Run” and magic will happen5. You will later figure out how to do more awesome things on your own.
Managing multiple tile sets
You may notice that the map is all white except for the 1891 map and that is good. The tile set URL only has the rectified map on it and nothing else. We need to have an additional 2014 tile set to compare (I will use an example MapBox Map ID, in case you did not create your own in step 3 above). We will replace the JS code with new one that will contain:
- some attribution information for the map (useful for when you want to, you know, attribute data in the map)
- the 2014 tile set
- a control that will let us swap one tile set for another
This code should replace your previous JS:
If you look throught this code you will notice it is quite similar to what we had before. The main differences are the addition of attributions and MapBox tile sets (via the map ID). The control itself is two lines: one to create a baseMaps variable that will hold the tile sets (you can add as many tile sets as you want) and another to create the control and add it to the map. Behold the control in action:
Notice how the attribution changes when you toggle the tile sets
We’re almost there! We now need to display our data. Leaflet makes this process quite easy since it natively supports GeoJSON. The process is just a few lines, but first remove the map zoom function map.setView([4.598056, -74.075833],14). Now paste this code at the bottom of the JS pane:
You need to copy the GeoJSON output from the text file you downloaded from GeoJSON.io and paste it where you see 'paste_geojson_here_keep_quotes'. Make sure you keep those quotes! That line should end up looking something like:
We replaced the zoom function with map.fitBounds(geolayer.getBounds()). This makes the map “smarter”: instead of us typing longitude, latitude and zoom level by hand we let Leaflet calculate the bounding area for the set of points provided with getBounds() and pass that as a value to the map’s fitBounds() function. Voilá, the map now zooms to show all the points in the set. If you add more points the bounds will change automatically!
You can also add the points and any other data overlay to the layer toggler. You just need to create a variable similar to the one you created for the tile sets and update the control creation code:
You will see something like this when you click “Run”:

Your map with custom data on it
Note: Make sure to move the control creation code L.control.layers to a point below where the GeoJSON is being parsed. The geolayer variable needs to exist for it to be added to the overlays. Refer to my JSFiddle result for details.
Another important line is the one with the L.geoJson() function. This function parses all the features described by the map.geojson. Leaflet/MapBoxJS have default blue pin icons for point features which you can customize if you want. L.geoJson() will also let us add some interaction to the pins. Right now clicking them does nothing.
Making the pins come alive
We want to click on the pins and show a popup box with the data we have associated to it (in the feature’s properties). We need to do two things:
- a function that will build and present the popup for a given feature (point)
- modify the L.geoJson() call to use this function
Leaflet’s bindPopup() layer function does just that: draws a box with text next to a given layer. This text can be marked up with HTML. Copy/paste this code below all you have so far:
This showPopup() function receives a feature, the piece of GeoJSON that contains all the information (geometry and properties), and a layer, the same GeoJSON as displayed by Leaflet (in our case, the blue pin). These two parameters are passed automatically by the L.geoJson() function. showPopup() then loops through each property in the feature (name, address, etc.) and builds an HTML string. This string is used as the markup for the popup.
We have not connected showPopup to anything. Modify your current L.geoJson line as follows:
…you are just adding , {onEachFeature: showPopup} after geodata. This tells Leaflet to apply the showPopup function for each feature in the GeoJSON.
Note: If your GeoJSON contains multiple types of features (e.g.: points, lines and polygons) you need to keep in mind the same function will be applied to all of them. For example, polygons have bounds but points do not. You will need to check to see if the feature being clicked has bounds before trying to fitBounds the map.
Running the map and clicking on a pin will result in something like this:
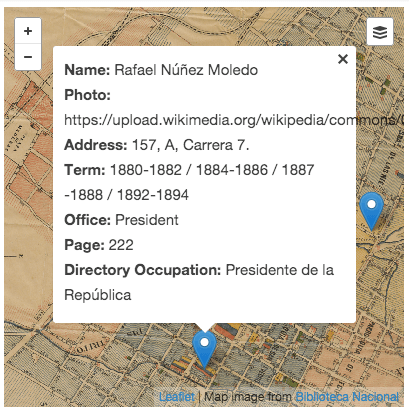
This is nice and all but wouldn’t it be better to actually see the photo and maybe link that page number to the directory itself? Let’s do just that! Replace the showPopup function with this one:
We just added a check in the loop: if key equals “Page” we build a link to the directory and if key equals “Photo” we build an image tag and constrain the height to 150 pixels (just in case the image is too big).
This is how Mr. Núñez looks like now:

…worthy of a president!
And we’re done!
Wrapping it all up
You will want to compile these three code snippets in an HTML page to publish your new map somewhere. Worry not, below is a code snippet that has the requisite spots for you to paste CSS, HTML and JS. Save all the code as a .html file and publish it somewhere:
You can see the finished map here. I made minor modifications to the CSS to fill the browser window.
Hope you found this tutorial useful. Drop me a line if you have any comments or questions!
- Similar to what happens with music when converted from CD quality to MP3. ↩
- Read this explanation for a better introduction on how web map tiles work. ↩
- I did not thoroughly research the names in question so it may be (however unlikely) that they are homonyms. ↩
- From GeoJSON.org ↩
- Everything should work this way! ↩